library(ggplot2)
library(patchwork)Prerequisites
To access the datasets, help pages, and functions that we will use in this code snippet, load the following packages:
Then make some data and ggplot2 plots to be used in the patchwork.
huron <- data.frame(year = 1875:1972, level = as.vector(LakeHuron))
h <- ggplot(huron, aes(year))

h1 <- h +
  geom_ribbon(aes(ymin = level - 1, ymax = level + 1), fill = "grey70") +
  geom_line(aes(y = level))

h2 <- h + geom_area(aes(y = level))
Shared x-axis labels
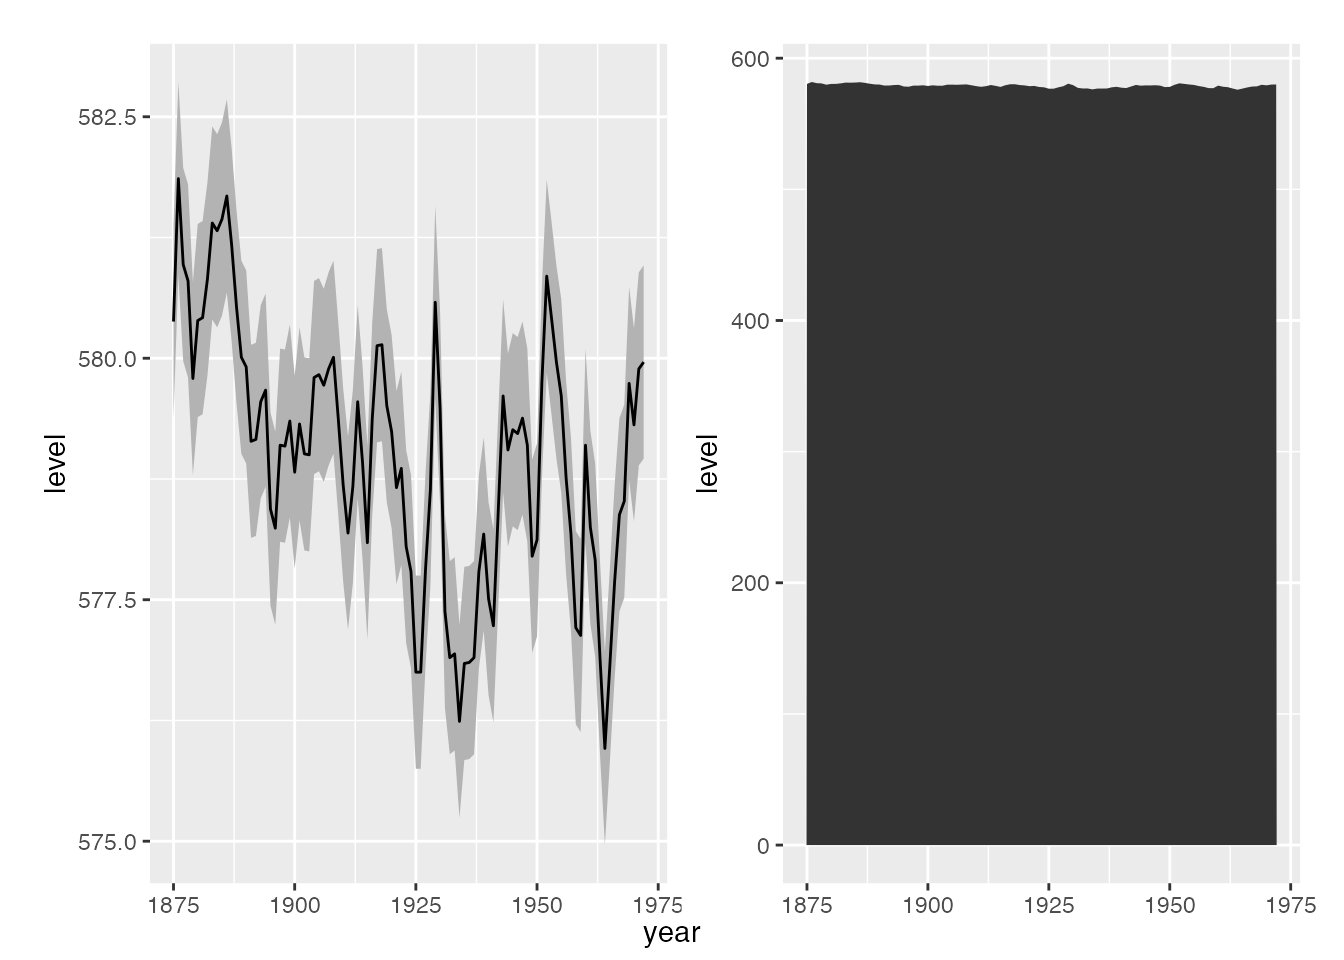
We set the bottom margin to 0 so the tag is in the same vertical position that the x-axis would otherwise be in.
# Create the patchwork, dropping the x-axis labels from the plots, and setting
# the margins
h_patch <- h1 + h2 & xlab(NULL) & theme(plot.margin = margin(5.5, 5.5, 0, 5.5))

# Use the tag label as an x-axis label
wrap_elements(panel = h_patch) +
  labs(tag = "year") +
  theme(
    plot.tag = element_text(size = rel(1)),
    plot.tag.position = "bottom"
  )
Shared y-axis labels
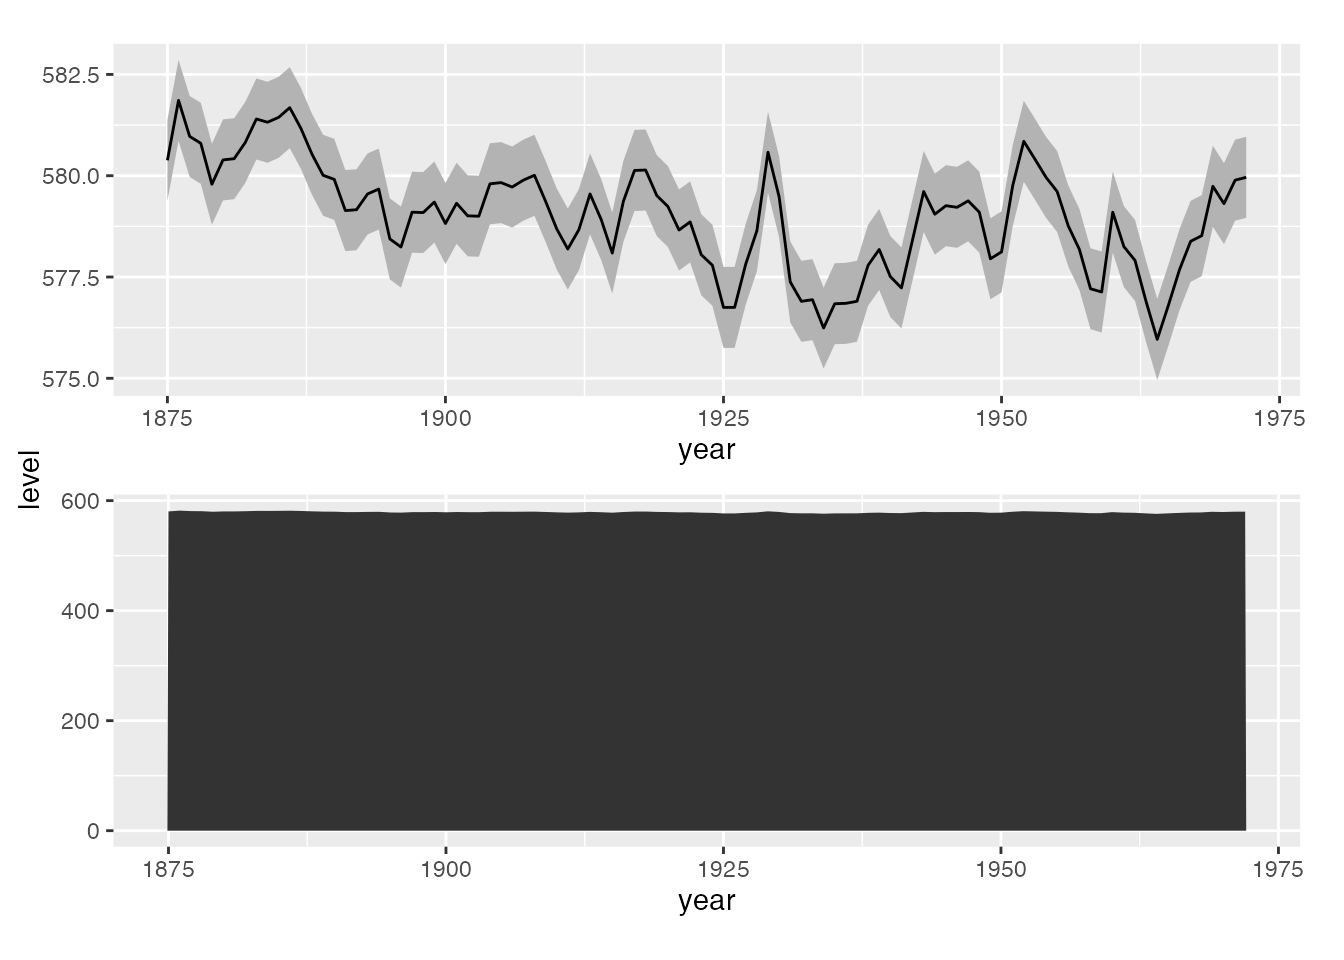
We set the left margin to 0 so the tag is in the same horizontal position that the y-axis would otherwise be in.
# Create the patchwork, dropping the y-axis labels from the plots, and setting
# the margins
h_patch <- h1 / h2 & ylab(NULL) & theme(plot.margin = margin(5.5, 5.5, 5.5, 0))

# Use the tag label as a y-axis label
wrap_elements(h_patch) +
  labs(tag = "level") +
  theme(
    plot.tag = element_text(size = rel(1), angle = 90),
    plot.tag.position = "left"
  )
Shared axis labels without using patchwork
Elio Campitelli shared a solution on Mastodon that accomplishes the same results as above, but without patchwork. It uses the magic tilde notation to create functions in the data argument of each geom that adds a grouping variable var that can be faceted on.
h <- ggplot(huron, aes(year)) +
  geom_ribbon(
    data = ~ transform(.x, var = "a"),
    aes(ymin = level - 1, ymax = level + 1),
    fill = "grey70"
  ) +
  geom_line(data = ~ transform(.x, var = "a"), aes(y = level)) +
  geom_area(data = ~ transform(.x, var = "b"), aes(y = level)) +
  # Since we don't care about the facet strips here, we can remove them.
  theme(
    strip.text = element_blank(),
    strip.background = element_blank()
  )
Facet by rows for a shared x-axis.
h +
  facet_wrap(vars(var), scales = "free_y")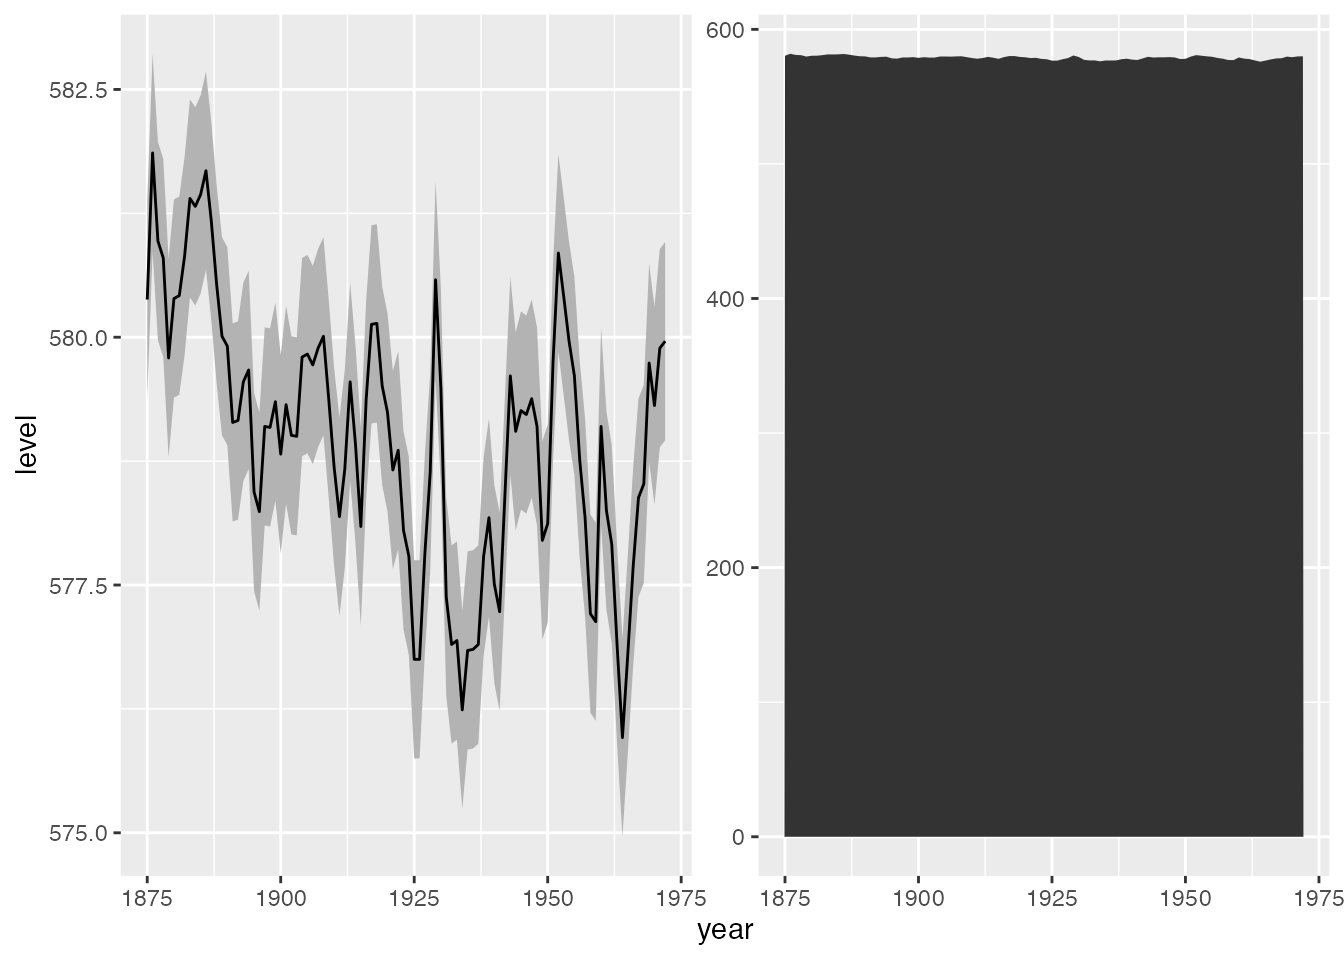
Facet by columns for a shared y-axis.
h +
  facet_wrap(vars(var), scales = "free_y", ncol = 1)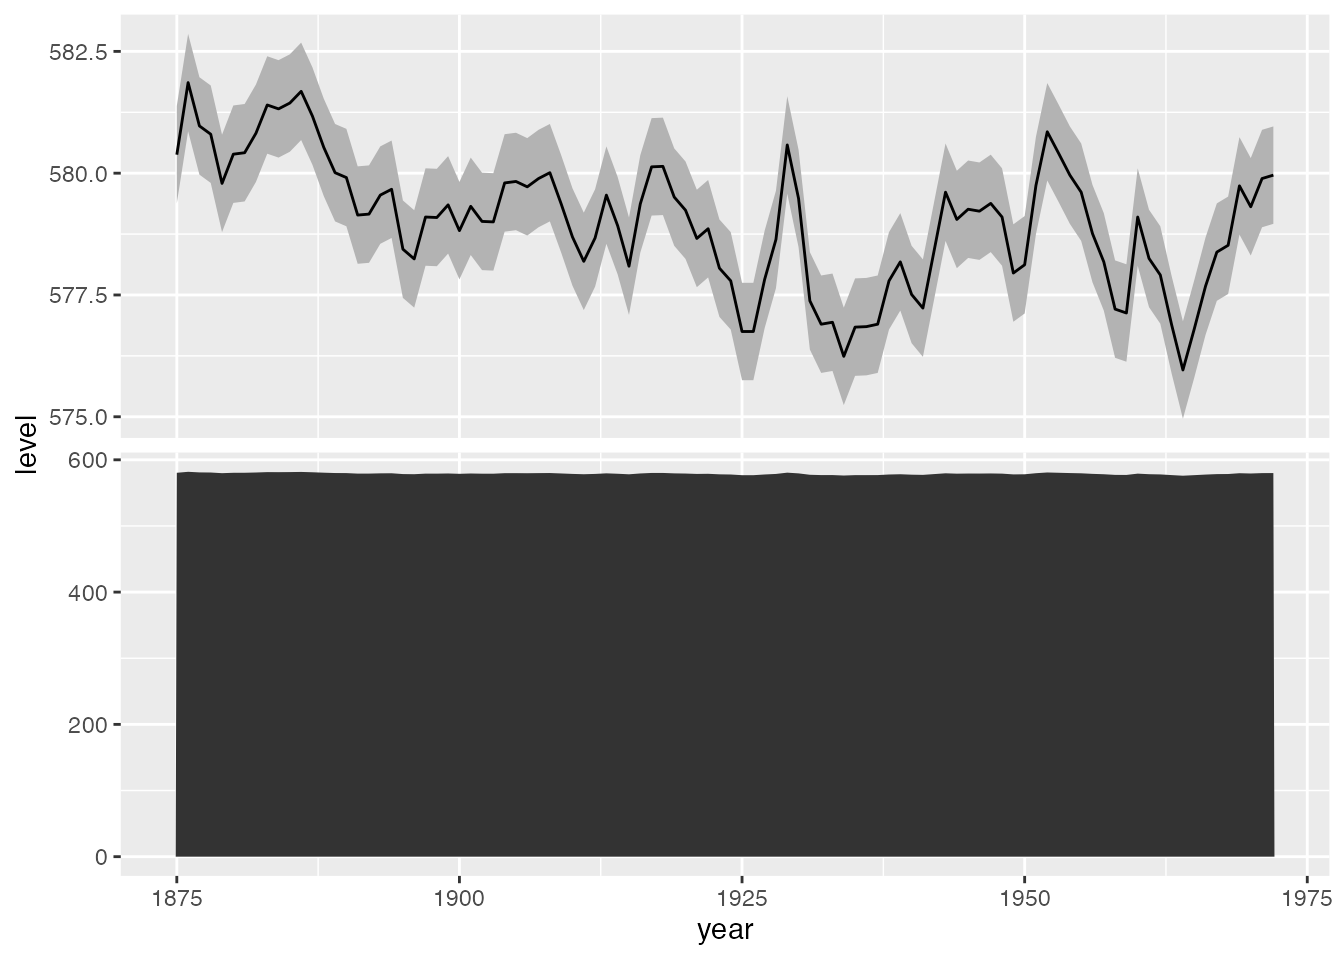
![]()
Michael McCarthy
Thanks for reading! I’m Michael, the voice behind Tidy Tales. I am an award winning data scientist and R programmer with the skills and experience to help you solve the problems you care about. You can learn more about me, my consulting services, and my other projects on my personal website.
Session Info
─ Session info ───────────────────────────────────────────────────────────────
 setting  value
 version  R version 4.2.2 (2022-10-31)
 os       macOS Mojave 10.14.6
 system   x86_64, darwin17.0
 ui       X11
 language (EN)
 collate  en_CA.UTF-8
 ctype    en_CA.UTF-8
 tz       America/Vancouver
 date     2022-12-22
 pandoc   2.14.0.3 @ /Applications/RStudio.app/Contents/MacOS/pandoc/ (via rmarkdown)
 quarto   1.2.280 @ /usr/local/bin/quarto

─ Packages ───────────────────────────────────────────────────────────────────
 package     * version date (UTC) lib source
 ggplot2     * 3.4.0   2022-11-04 [1] CRAN (R 4.2.0)
 patchwork   * 1.1.2   2022-08-19 [1] CRAN (R 4.2.0)
 sessioninfo * 1.2.2   2021-12-06 [1] CRAN (R 4.2.0)

 [1] /Users/Michael/Library/R/x86_64/4.2/library/__tidytales
 [2] /Library/Frameworks/R.framework/Versions/4.2/Resources/library

──────────────────────────────────────────────────────────────────────────────
Reuse
Citation
BibTeX citation:
@online{mccarthy2022,
  author = {Michael McCarthy},
  title = {Shared Axis Labels in Patchwork Plots},
  date = {2022-12-22},
  url = {https://tidytales.ca/snippets/2022-12-22_patchwork-shared-axis-labels},
  langid = {en}
}
For attribution, please cite this work as:
Michael McCarthy. (2022, December 22). Shared axis labels in
patchwork plots. https://tidytales.ca/snippets/2022-12-22_patchwork-shared-axis-labels
Comments